I’m experiencing problems with loading the dashboard in the Chrome browser. In Safari everything is working fine, but in Chrome it keeps on showing the loading icon. Does anyone know how to solve this? 

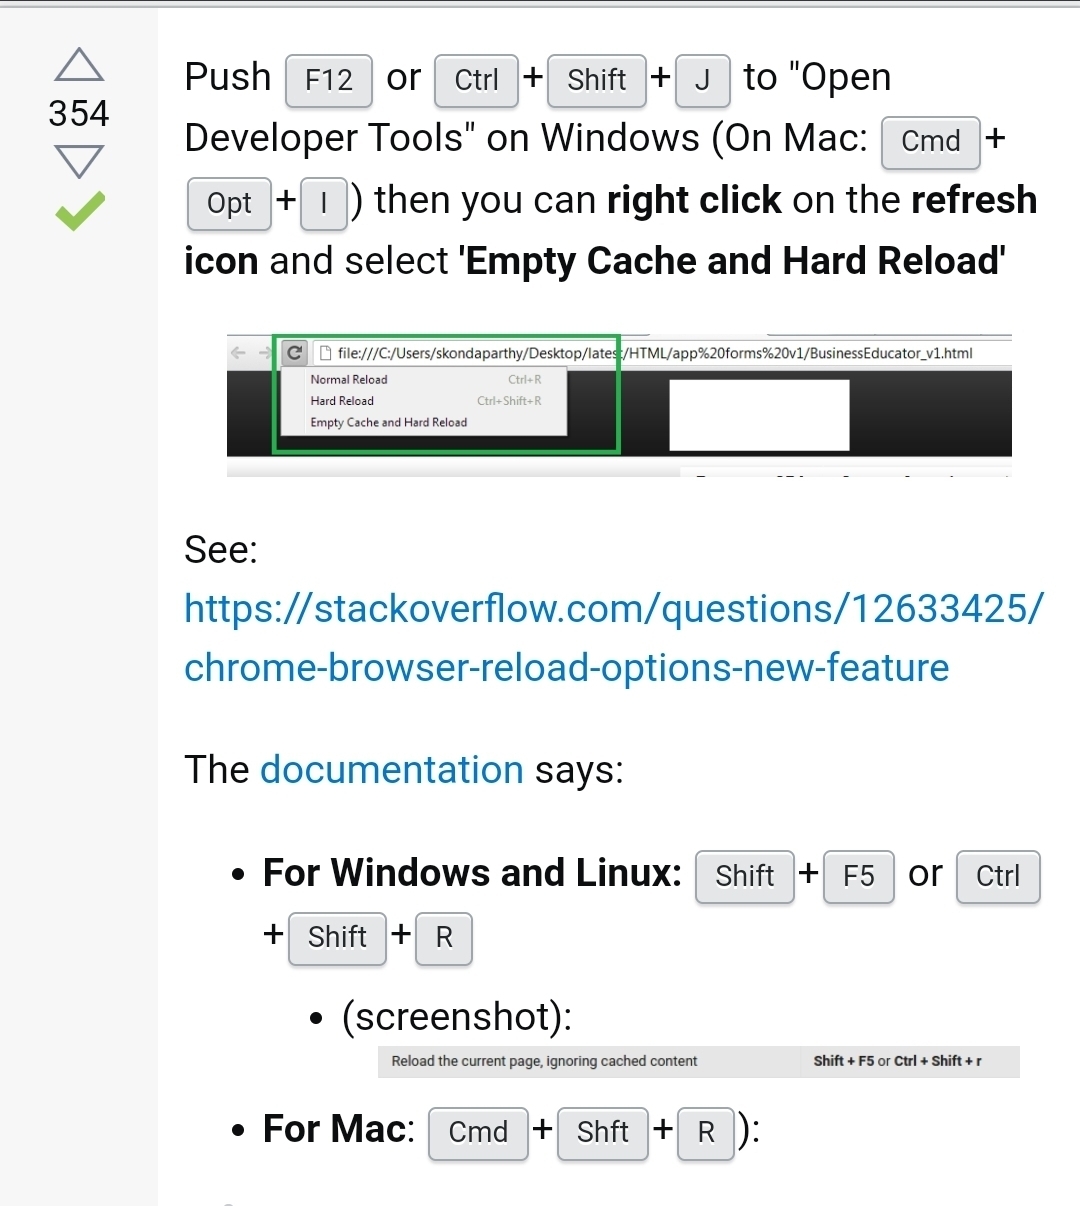
@Jeroen Heerema - It sounds like you may need to clear your Chrome browser's cache. A quick Google search on how to do this showed me this:


If that doesn't work, I would suggest trying to sign in via an incognito window in Chrome.

And if still not working, try disabling any installed browser extensions.

Finally, try completely removing and re-installing Chrome.


Thanks @Robert Johnson for your suggestions. Unfortunately the steps you proposed didn’t work for me. 

But when I opened the “Developer tools” in Chrome I noticed the warnings below. Perhaps that’s the problem?

  • DevTools failed to load SourceMap: Could not load content for https://miro.com/app/static/https:/miro.com/app/static/applicationInlineEntry.489139871003176fb2fa.js.map: HTTP error: status code 403, net::ERR_HTTP_RESPONSE_CODE_FAILURE
  • DevTools failed to load SourceMap: Could not load content for https://miro.com/app/static/lazy-local-storage.1bec31a0740be0e2da8d.js.map: HTTP error: status code 403, net::ERR_HTTP_RESPONSE_CODE_FAILURE

@Jeroen Heerema - Those may not have been the best steps. These appear to be more official ones directly from Google: https://support.google.com/accounts/answer/32050?co=GENIE.Platform%3DDesktop&hl=en


@Robert Johnson This also didn’t help… 


Found the fix! After I updated my Macbook to the latest MacOS (Big Sur) it started working again. 

Thanks for your help @Robert Johnson