
Trend/Line charts in Chart template

  • Feb 18, 2026 12:52 AM UTC
  • 2 replies
  • 117 views

Forum|alt.badge.img

hi
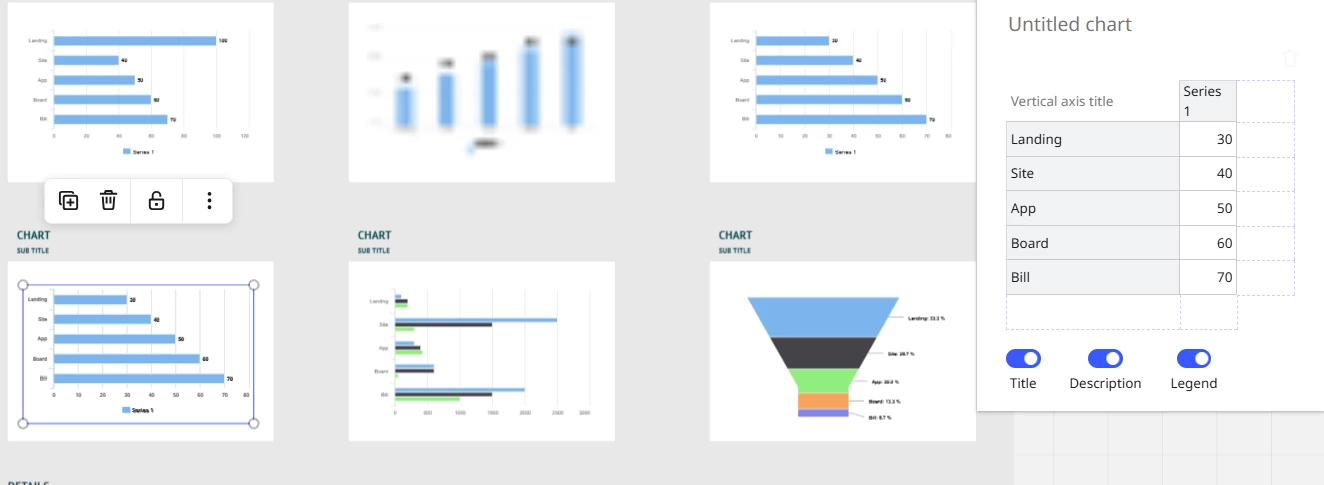
I’m building a dashboard wireframe and using the Charts which is great

one type that is lacking is trend lines

is there a way around/hack - but able to use the dummy data pane would be great


2 replies

Eca
Mironeer
Forum|alt.badge.img+5
  • Mironeer
  • Feb 20, 2026 3:43 PM UTC

HI ​@Frederic Fery 

thanks for reaching out! If you’d like to keep using the dummy data pane, your best option is to:

  • Add a manual line shape over the chart and group it with the chart.

There isn’t a built-in trend line toggle at the moment. If this is something you’d like to see in the future, I’d recommend adding it to the Wish List post so the product team can track the demand.


Forum|alt.badge.img
  • Contributor
  • Feb 21, 2026 8:10 PM UTC

Hi, trend lines are not natively supported in most chart templates, so there isn’t a direct toggle for them. A common workaround is to add an additional data series that represents the trend line and style it differently so it appears as a smooth line over your main data. You can generate the trend values manually in your dummy data pane and use that as the second series.