
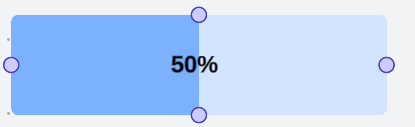
I’m creating a heatmap that shows progress for each process. I’ve built it in Lucid and can automate the filling in of a shape to reflect the progress of the task. So basically, I want to have a process map, then be able to click on each (dynamic) shape, add some shape data into the background (i.e. 50 for the shape to then show a progress colour up to 50%)
any ideas? thank you
Link to solution on Lucid for context… Progress bar shapes in Lucidchart | Community