The mindmap board can fit a lot of data from text and media files, which is good, but it is also a problem. Because downloading a large amount of data at the same time slows down weak computers with weak Internet.
To solve this problem, you can create several levels of data visualization. At the first level, you see general data level 1, and when a specific area reveals more detailed data level 2 details of a specific topic.
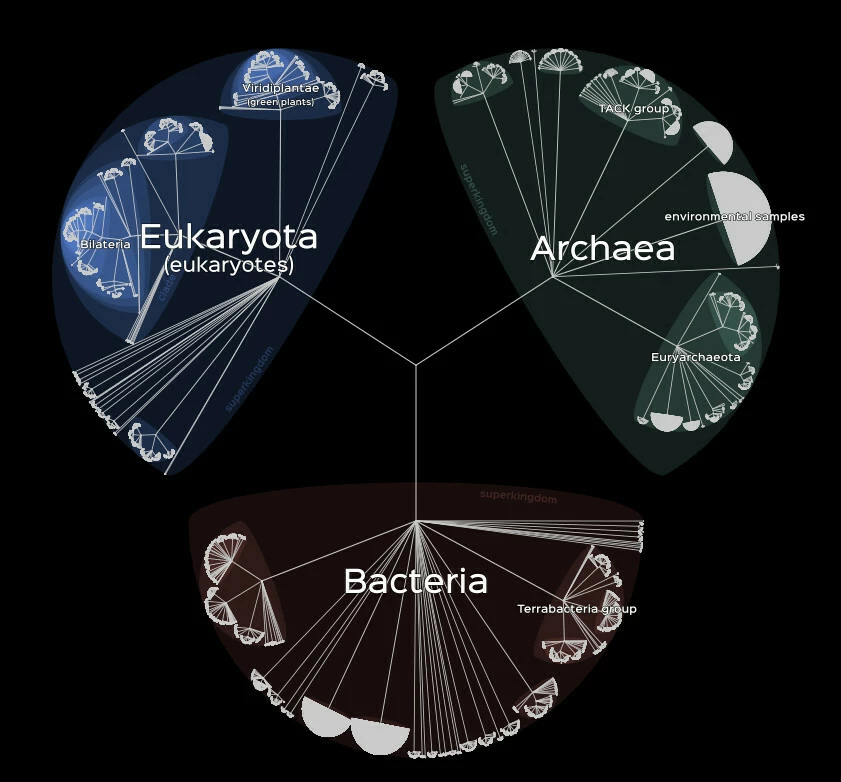
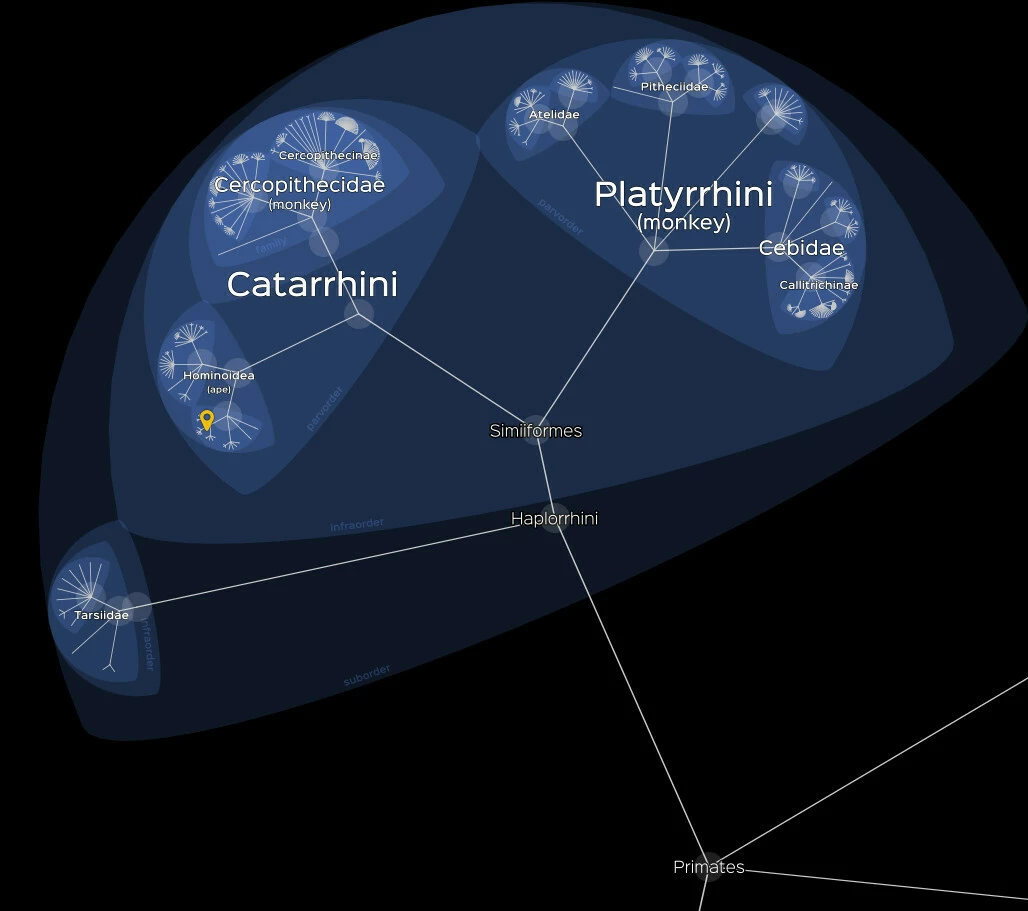
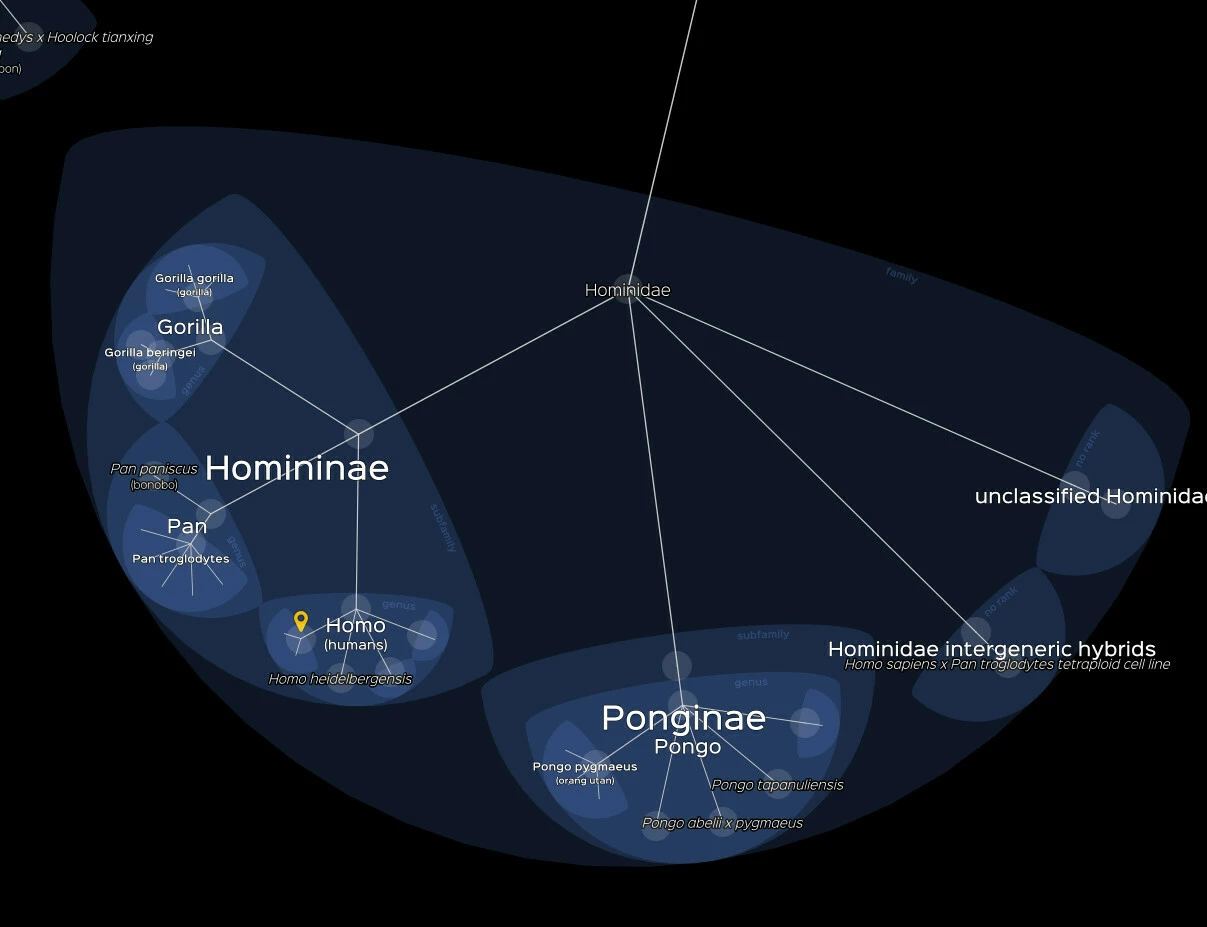
For example, I can say that this is implemented on the Life map website, it is also used in cartography using Google Maps, when you first see the general map of the earth and then when zooming you can see a specific street. In mind map, it can be like this: 3 pictures with different themes at level 1 in which you vibrate the direction towards one picture and begin to see several pictures with text diagrams and a diagram as you zoom in, then more and more at each new level.
This will solve the optimization problem, so that at the initial level 1, most of the data will be hidden, but you will know where to go to get detailed information at each new level of immersion, you will receive more data. Thus, this optimization of the service will allow you to use it easily on mobile devices.