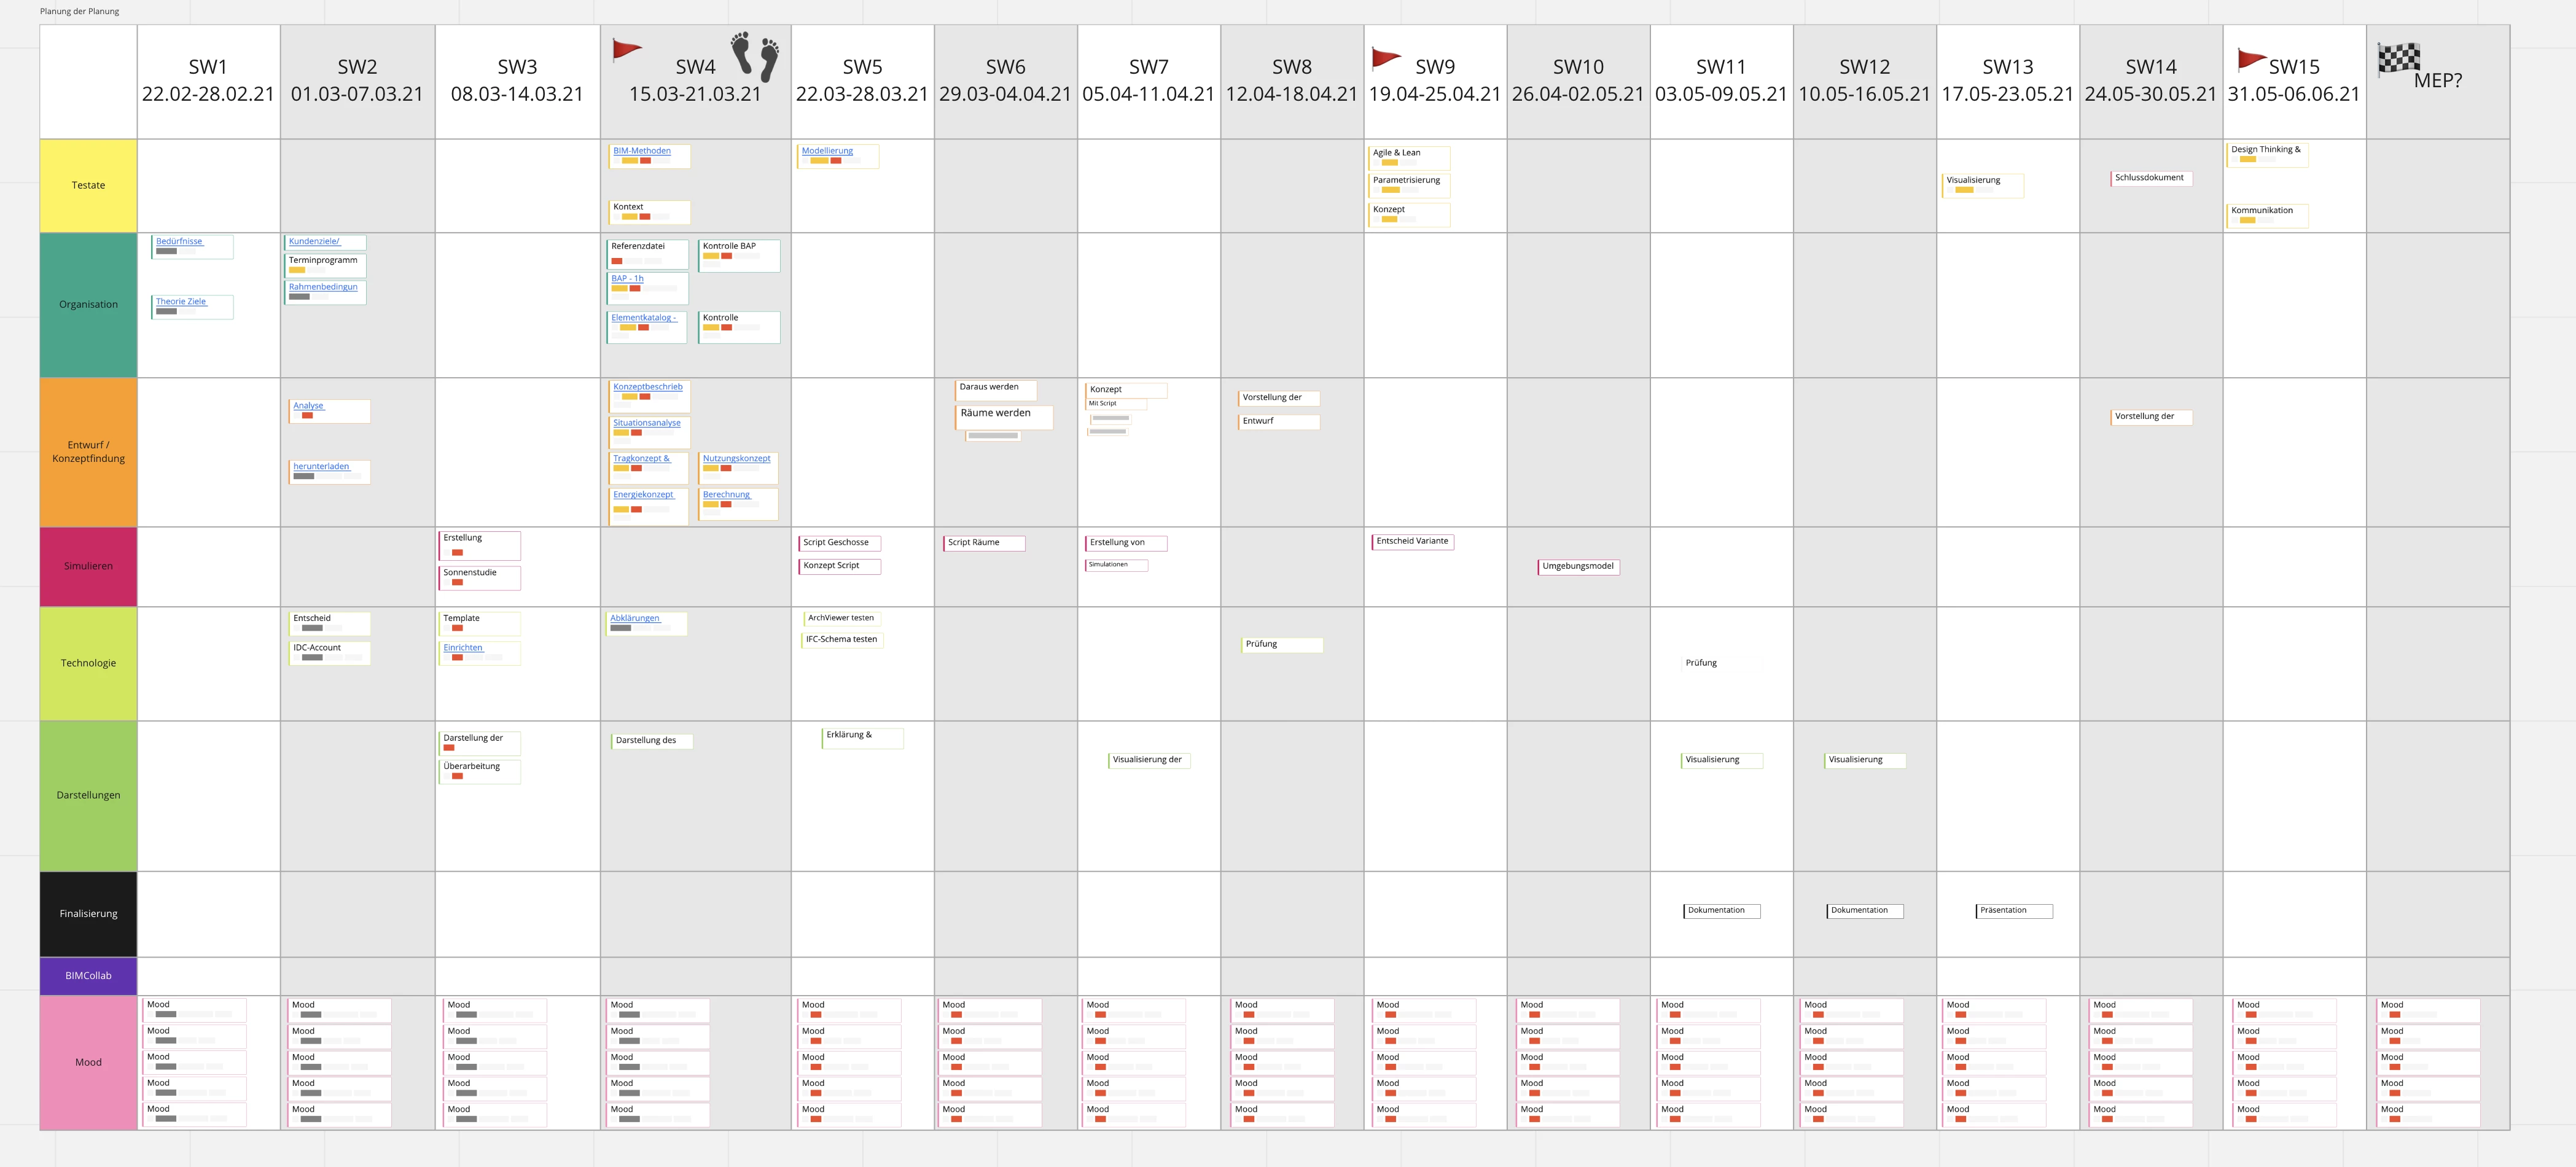
We’re using miro to plan our projects and organize the issues per tag, calendar and user. We can sort them with cards and the @function and can search them by tags. If there are many issues and a big team, it’s hard to find your own issues with the tag “open”, because there are many. The other thing is to get a statistic of the issues who are open. We can export the table with csv and connect this csv with power BI, export a jpeg an put that back to miro. You see, that’s a long workflow and you’ve to do that daily or weekly.
Often we use more than one issue-tool in a project, because every software has some addons, but no for every software;) So we’ve many dashboards and don’t know where we should have a look at. In our opinion a solution could be the connection with power BI. For that we should have the possibility to control the output of the table with a live-connection in power BI (for example). In power BI we can connect all the issue databases and can show this dashboard in miro. So the user can go to miro and see the dashboard of the issues and know where he should have a look at.
Another example is brainstorming;) How to structure all the ideas? We often use tags for different topics and it would be really interesting to see, how many ideas have been created in which topic.
Summary - it would be great to analyse the miro-board with tools like power BI.

