Hey Friends,
I am creating data visualizations on different domain data.
Normally I am using Google Sheets for No Code add-on for this purpose.
I have more knowledge about Excel & Office 365 use code free add-in for data visualization purpose.
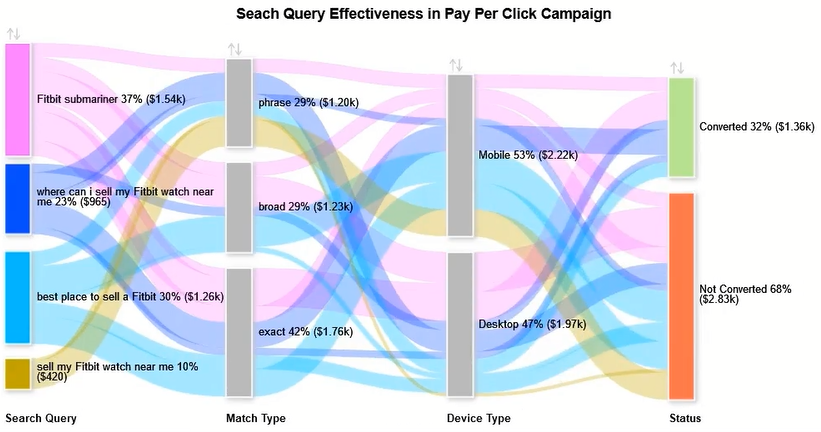
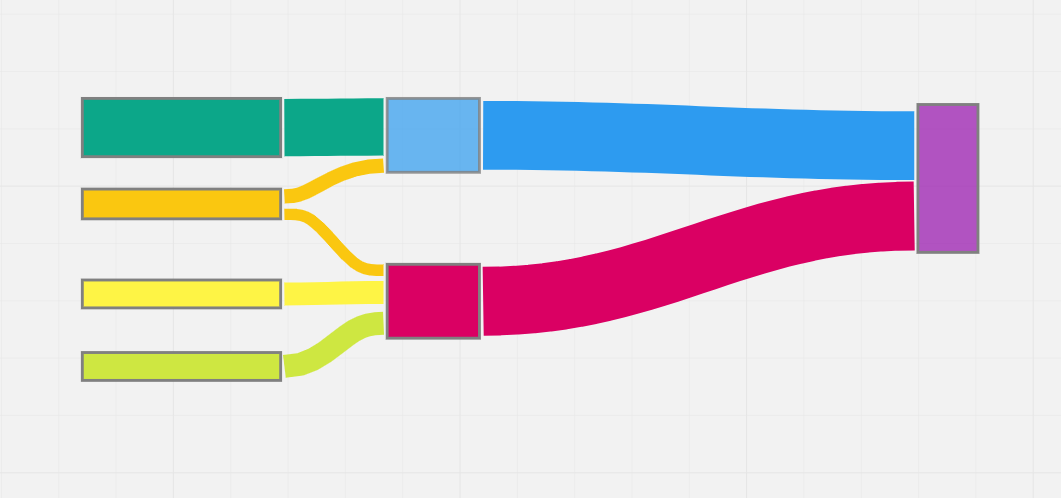
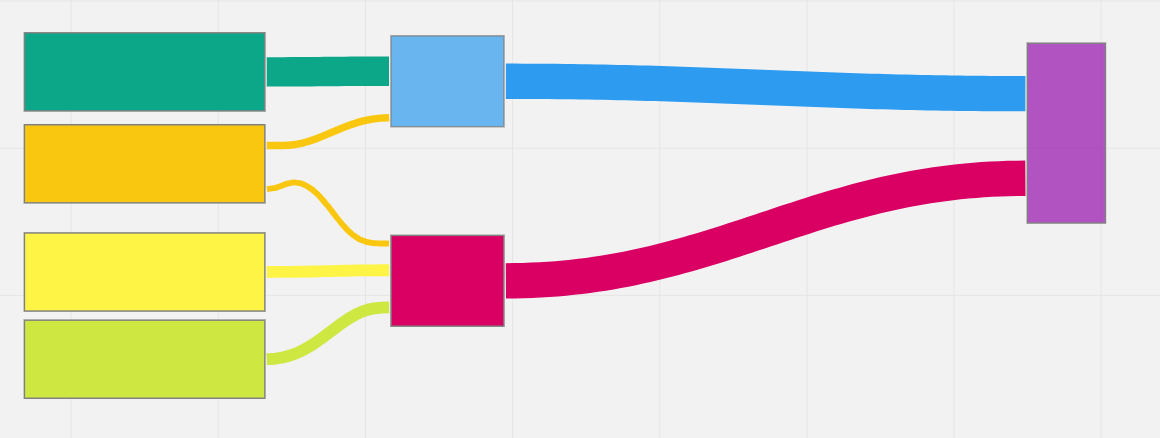
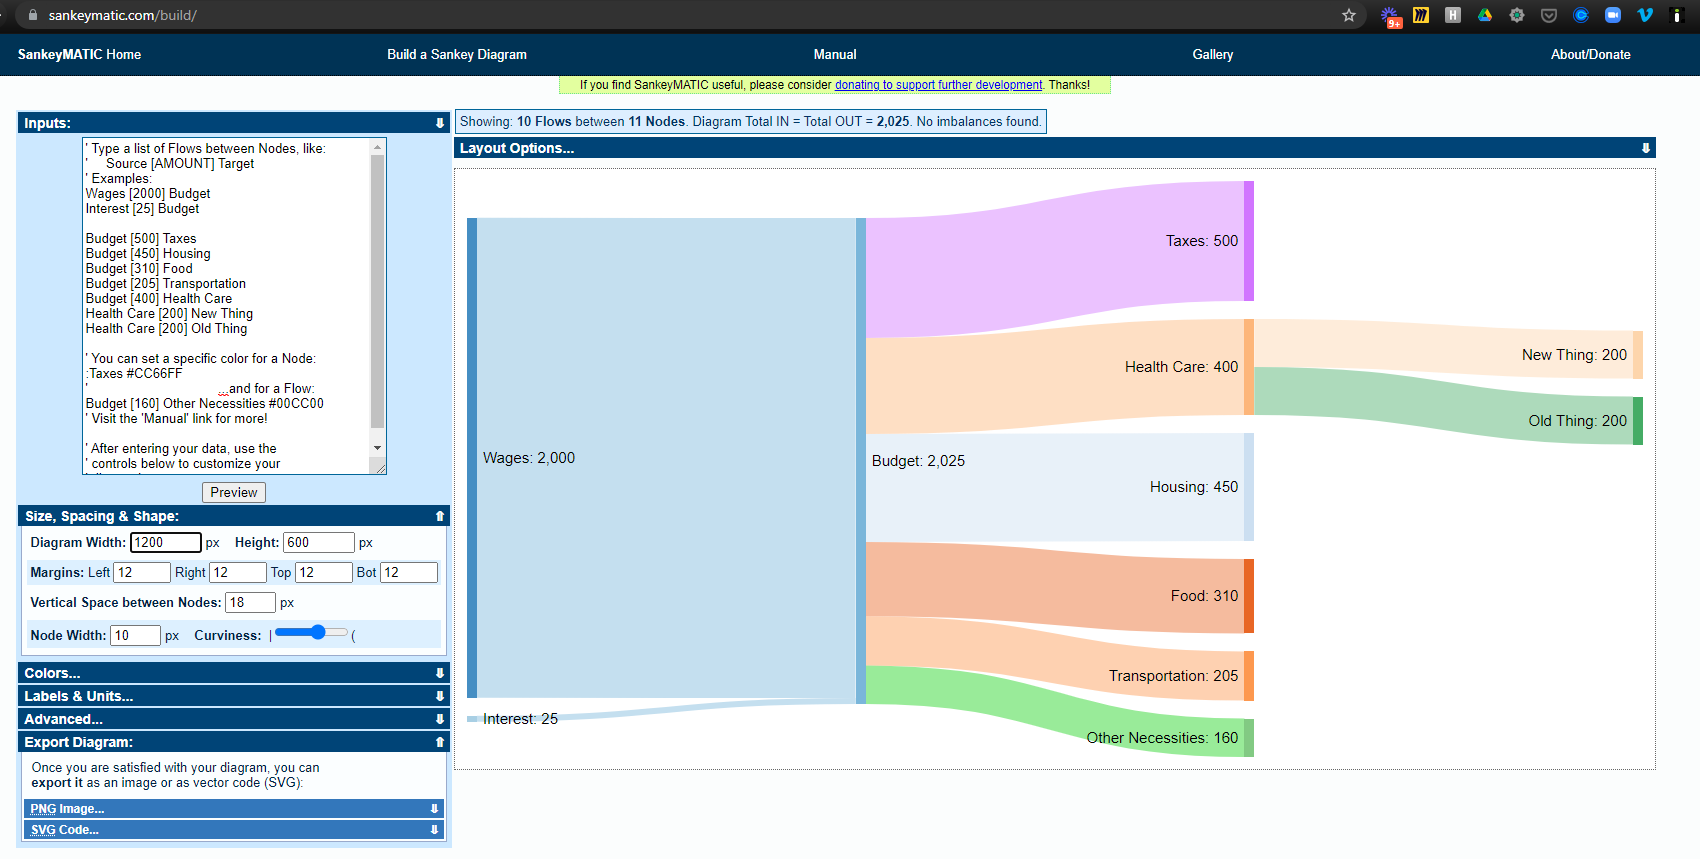
Recently created Sankey chart (Users Search Terms Flow in running campaign) with these add-ins. Image is attached.
How I can import this chart in miro for data story telling purpose.
Thanks
--CF