
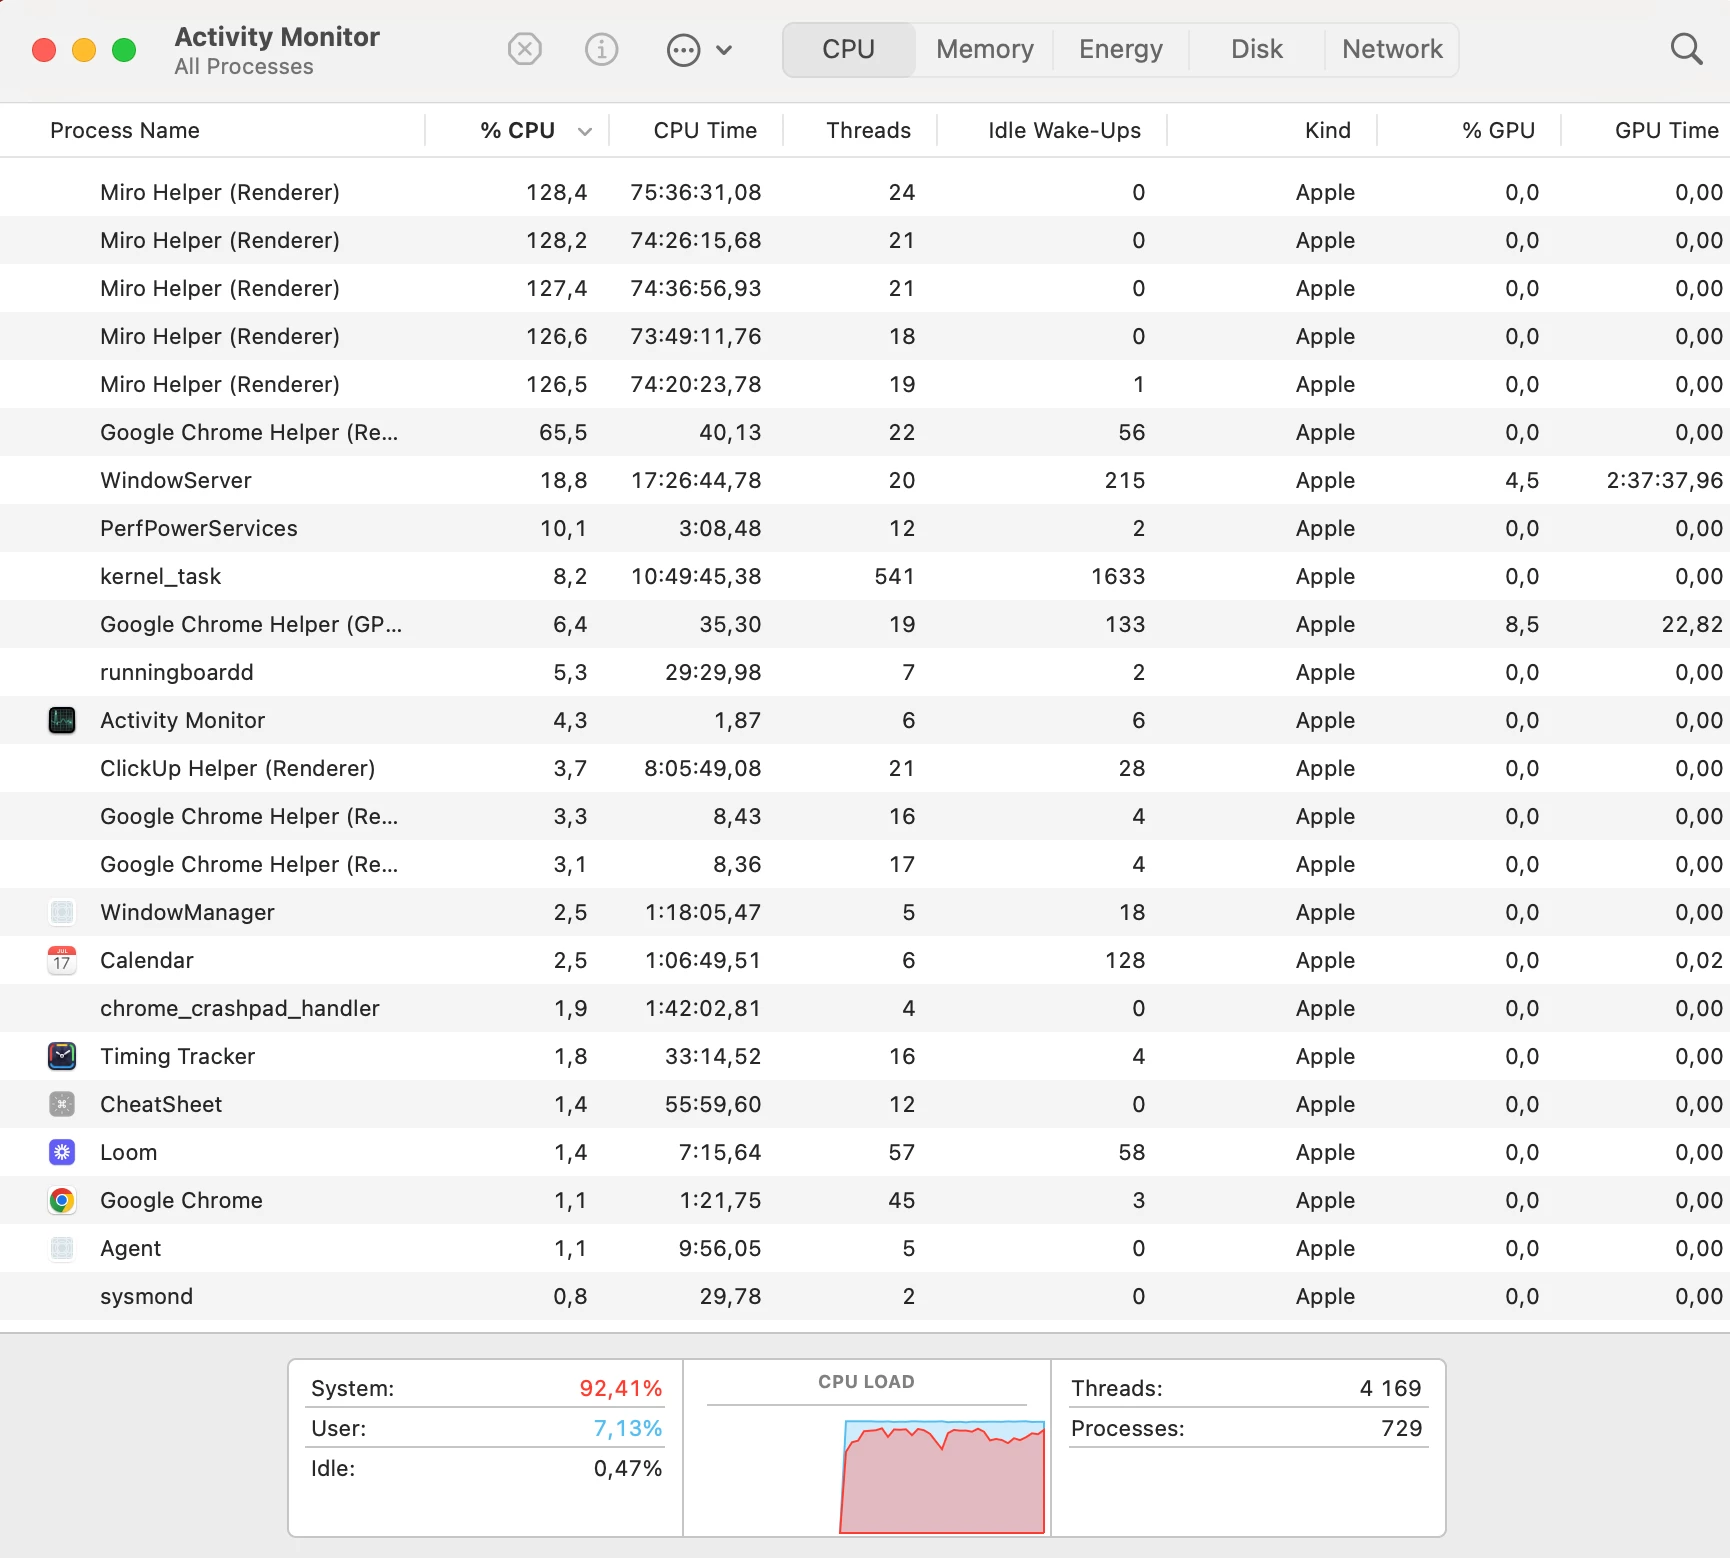
I was wondering if anyone else has run into this issue where the laptop (mine is a workstation laptop) has its cooling fans running continuously on high whenever Miro is running (either on app or especially in browser). It doesn’t matter how big or small the board, all I need to do is keep the app or the browser version open (even in the background) and wait a few mins to hear the cooling fans running at peak speed. Is this a bug or an issue with inefficient code causing poor handling of system resources? The same issue also seems to cause system crashes when Miro is opened while a cad application is also running (SolidWorks) simultaneously.

Hi @VinayP! I've never experienced that. The only time the cooling fans run like crazy for me is when the desktop app has a new update. I have a MacBook though.


@VinayP -

I’ve never encountered this and I’m using Miro, multiple MS Office applications and Zoom all at the same time with video & audio streaming.

Kiron


@VinayP What kind of laptop do you have? 


Hi, I’m suddenly having this same issue on a Dell precision. Tried clearing cache, different browsers, rebooting, etc. 


Hi ​@Anna Ahn, thanks for jumping in and sorry to hear you're experiencing this!


Since you’ve already tried clearing the cache, rebooting, and using different browsers, here are a few additional things you might try:


Check Task Manager or Activity Monitor
This can help pinpoint whether Miro (browser or app) is causing sustained high CPU/GPU usage—even when idle.


If possible, test in Incognito mode
This disables extensions and can rule out a browser extension conflict.


If the issue persists, feel free to share a short screen recording or screenshot of your Task Manager/Activity Monitor while Miro is running. That info could help if we need to escalate to the support team for a deeper look.


Let me know how it goes—happy to help however I can!


Thanks ​@Eca for the fast response! I forgot to mention Incognito earlier- tried it to no avail. Any recommendations on how I can access Task Manager or Activity Monitor? 


Thanks for the update, ​@Anna Ahn!


Here’s how you can access your system’s performance monitor, depending on your device:

On Windows

  • Press Ctrl + Shift + Esc to open Task Manager directly

  • Or, click the Start menu and type "Task Manager" into the search bar

In the Processes tab, look for Miro (browser or app) and check its CPU, Memory, and GPU usage. If it’s running high—even when idle—feel free to take a screenshot and share it here.


Let me know what you find!


Thanks, I’ve submitted a support ticket and am now in contact with support representative. 


I encountered the same issue - my MacBook Air with M2 chip heats up a lot when using Miro. I had to get rid of the Miro app for now.


Hi all, thanks for sharing your experience. Miro performance can depend heavily on the board’s content—large/high-res images, PDFs, and pen drawings are resource-intensive and can lead to overheating or lag, especially on lighter devices like MacBook Airs.

Here are a few tips that might help:

  • Try reducing heavy content (e.g. convert PDFs/images to smaller JPG/PNG files)

  • Use Chrome in Incognito Mode to rule out browser extensions

  • Close other tabs and background apps

  • If the issue continues, try duplicating the board to see if performance improves

More tips here: Optimize Board Performance


If this does not help, you can reach out to supports and let them know the following: 

  1. if this issue happening when only a Miro dashboard is opened or is it happening when opening a board?
  2. one of the board links where you encountered the overheating in this format: https://miro.com/app/board/o2J_ktk9Pg5=/?
  3. Device information like OS, version, etc

Hope this helps! Let me know if you need help reaching the Support team.