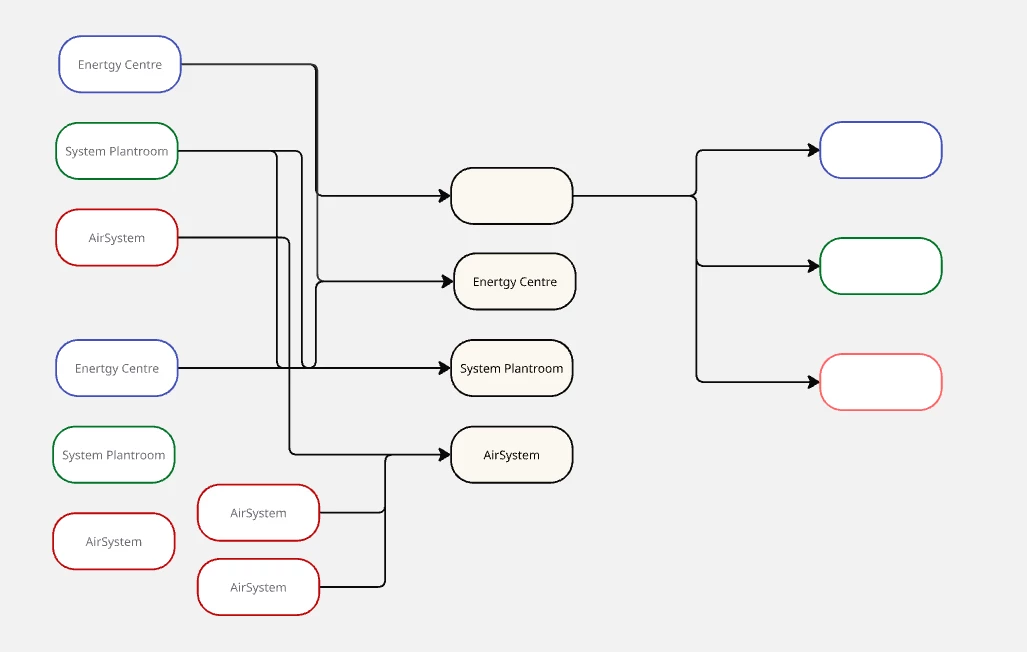
I’m trying to replicate my chart flow in Miro to better understand the logic behind my workflow.
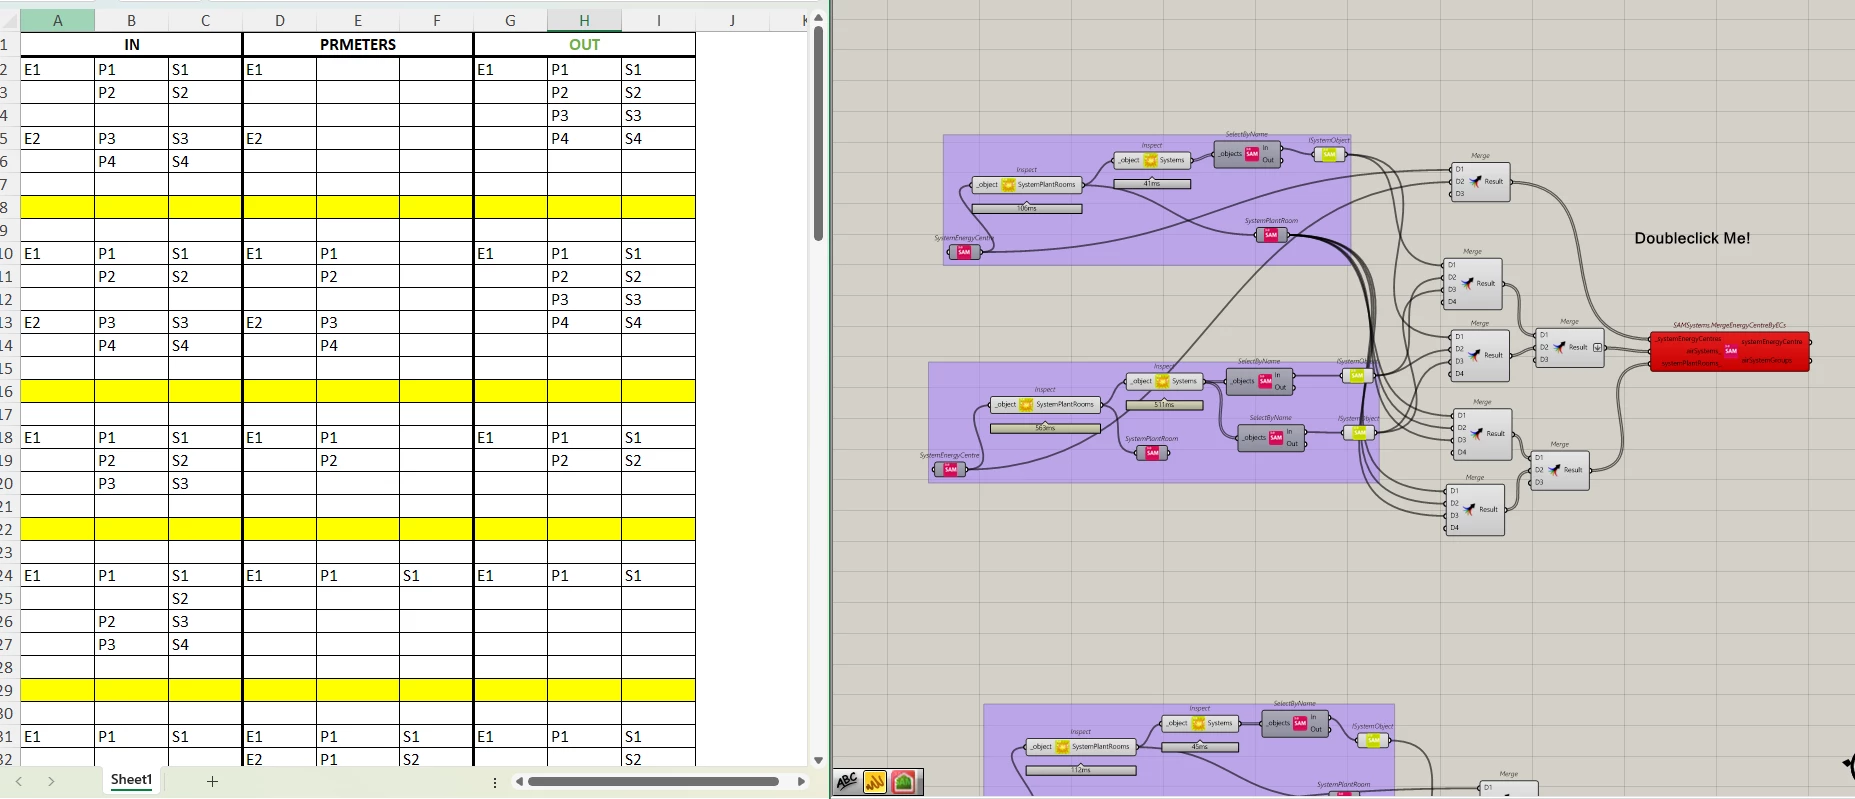
Currently, I need to use a mix of Grasshopper and Excel.
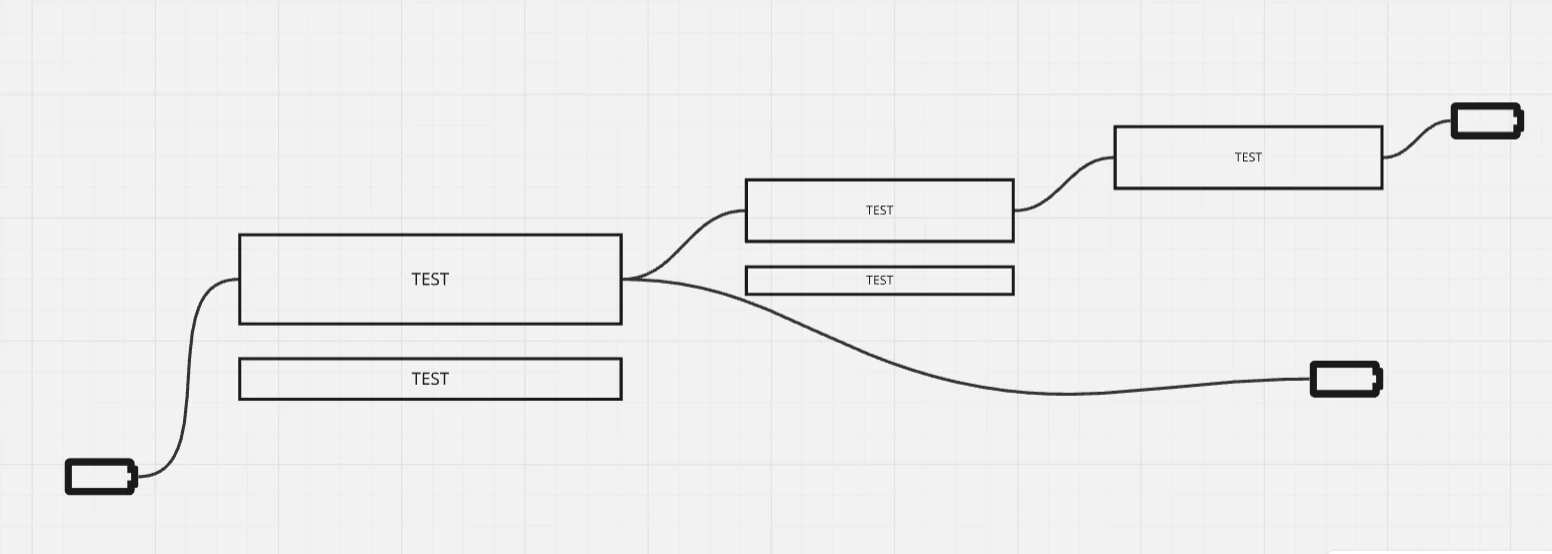
I tried using Miro, but I wasn’t able to find a way to create multiple input/output nodes and connect them with black arrows without the connections overlapping.
Could I get some advice on how to do this?
Page 1 / 1
Hi @Michal Dengusiak,
Thanks for reaching out! and for sharing your setup. I can definitely see why you're trying to replicate your workflow logic in Miro—great way to visualize things clearly.
From what I see, the limitation you're running into stems from the way Miro’s mind map tool enforces its own structure and hierarchy, which can be restrictive when you want total freedom over connections.
I tried recreating your logic using basic shapes and wireframes instead of the mind map tool. This gives you way more control. Here's what I recommend:
Use standard shapes (rectangle, line, circle) to build your nodes Label them manually Connect using arrows (Shift + drag or from the shape's handles) To avoid overlaps, use grid snapping or enable “smart layout” in settings If you need multiple connections from one node, just duplicate handles or branch out arrows manually
Here’s a quick preview of what I tried on my end—just using simple blocks and manual lines for connections.
Let me know if you need help with anything!
Reply
🚨 Last chance for early-bird tickets to Canvas 25! 🚨