Answered

How can I enable voting on multiple items in a board?

  • 22 September 2020
  • 3 replies
  • 770 views

Userlevel 1

Hi all,
I have a visual mapping (shapes with text connected by arrows) of many variables that affect a particular context (with the various connections shown).  At an online workshop, I wish the 15 or so participants to be able to indicate which variables they think most and which least significant (using a scale of 1-5 or colour scale).  There are around 30 variables, and I hope all 15 participants will place a vote on every variable.

We shall then discuss the ones that score highest. My challenge is how to make this easy for participants who have not used Miro before?

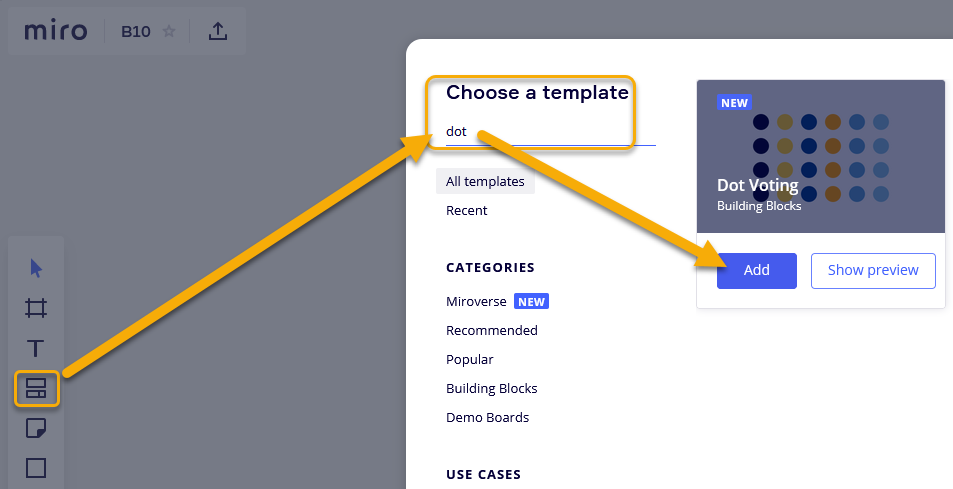
I thought about using coloured dots, but cannot find any!  One can make dots using the circle shape, but I’m at a loss as to how to fix the size (visually it won’t work if the dots are different sizes)

I’m also considering using the number emojis, hoping people won’t re-size them manually.  But as they are all grey, the visual impact is lower.

Any idea how to create a ‘dot’ with fixed size?
Or any better ideas how people can ‘rate’ the differing text boxes on a mind map?

Thanks

icon

Best answer by Robert Johnson 22 September 2020, 15:45

View original

3 replies

Userlevel 7
Badge +12

@Nic Parham - Dot voting sounds like a good option for you. You can make your own dots using the circle shape or grab a bunch of dots from the Doc Voting template and then copy and change the color(s) to your liking. 


Then copy and change the color if you’d like:


Or make your own dots:


The only way to lock the size of the dots would be to Lock them, but then participants could not move them.

Dots could also work for voting on your Mind Maps, but if you have a paid plan, the Voting app could work too.

Userlevel 1

Thanks.  These dots might work. - although a shame the size cannot be locked.
I looked at the voting app, as I do have a paid plan, but it seems that people can only opt to vote for something or not. It doesn’t permit allocating a depth of preference so won’t work in this instance. 

Userlevel 1

This isn’t really an answer about using Miro but more about using individual strength of preference scales vs individuals voting for 7-10 variables from the 30, when eliciting a group’s strongest preferences  


Have you thought instead of using simple dot voting for the variables they consider most significant?  Give them 7-10 votes each, and you’ll end up with a ranking based  on the total number of votes each variable received.


Given how much easier voting is for participants, my rule is to do it this way UNLESS I had to do some other analysis like regression, or if I  needed the group to understand the variability of their responses across all 30 variables.


Here’s my rationale 


A while ago I worked for a research and benchmarking business. We did a LOT of survey design and I was lucky to work with a Research Director who was passionate (for a statistician) about making every survey as easy to complete as possible, and to decide what kinds of questions were ‘easier’ using data.  And so he insisted on including questions to test question design choices in our annual benchmarking study - which typically received around 14000 completes. 


He was most proud of the A/B tests he ran to prove to us consultants that it was completely unnecessary to ask individuals what their strength of preference was on each dimension/attribute IF you were interested in the _group’s_ overall preference - all you need to do is to present a forced choice, where the respondent sees the entire list of dimensions/attributes and is asked “which of the following attributes do you think are MOST important (select up to X attributes)?” Essentially a very simple multi-response checklist question  

His testing showed clearly that either method produced the same ranking of the attributes, and the same relative strength _between_ attributes. The scale questions also produced less discriminating results - the differences were just so much easier to see when presenting the data.


.But the user experience was completely  different - there’s a huge difference in time and cognative load between answering 30 scale questions, and choosing your top 7, 8 or 9 top attributes from a list of 30.


(Note that itdoes mean the results you get don’t have a measure of variability like std.dev. Which limits the kind of analysis you can do, but here  it sounds like that wouldn’t be necessary?)

Reply