Greetings!
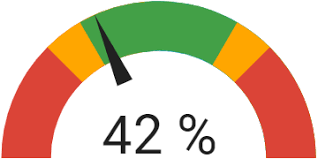
Looking for any advice and guidance on the easiest way to create and embed a gauge chart in miro.
These kinds of charts are easy to make in PowerBI or Tableau, but do not appear to be supported natively in Miro. If someone knows of a super simple way to create them and embed them, please let me know! If the only way forward is to use PowerBI or Tableau, so be it, but I am hoping to avoid (for now) the time and expense of purchasing one of these tools and learning it-- seems overkill when all I want is a simple gauge. many thanks!


